Ho to do group by count in R? By using aggregate() from R base or group_by() function along with the summarise() from the dplyr package you can do the group by on dataframe rows based on a column and get the count for each group.
Since using the group_by() function from the dplyr package is an efficient approach, I will cover this first and then use the aggregate() function from the R base.
1. Quick Examples
Following are quick examples of how to perform group by count.
# Load dplyr
library(dplyr)

# Group by count using dplyr
agg_tbl <- df %>% group_by(department) %>%
  summarise(total_count=n(),
            .groups = 'drop')

# Convert tibble to df
df2 <- agg_tbl %>% as.data.frame()

# Group by count of multiple columns
df2 <- df %>% group_by(department,state) %>%
  summarise(total_count=n(),.groups = 'drop') %>%
  as.data.frame()

# Group by count using R Base aggregate()
agg_df <- aggregate(df$state, by=list(df$department), FUN=length)

# R Base aggregate() on multiple columns
agg_df <- aggregate(df$state, by=list(df$department,df$state), FUN=length)
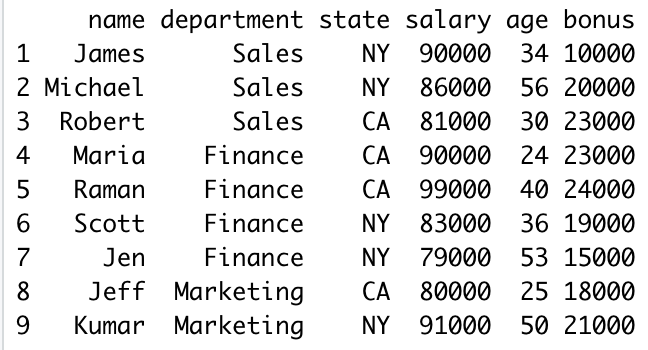
Let’s create a DataFrame by reading a CSV file.
# Read CSV file into DataFrame
df = read.csv('/Users/admin/apps/github/r-examples/resources/emp.csv')
df
Yields below output.
2. Group By Count in R using dplyr
You can use group_by() function along with the summarise() from dplyr package to find the group by count in R DataFrame, group_by() returns the grouped_df ( A grouped Data Frame) and uses summarise() on grouped df to get the group by count.
To use these functions first, you have to install dplyr first using install.packages(‘dplyr’) and load it using library(dplyr). I will use dplyr infix operator %>% across all our examples as the result of the group_by() function goes as input to summarise() function.
# Load dplyr
library(dplyr)
# Group by count using dplyr
agg_tbl <- df %>% group_by(department) %>%
summarise(total_count=n(),
.groups = 'drop')
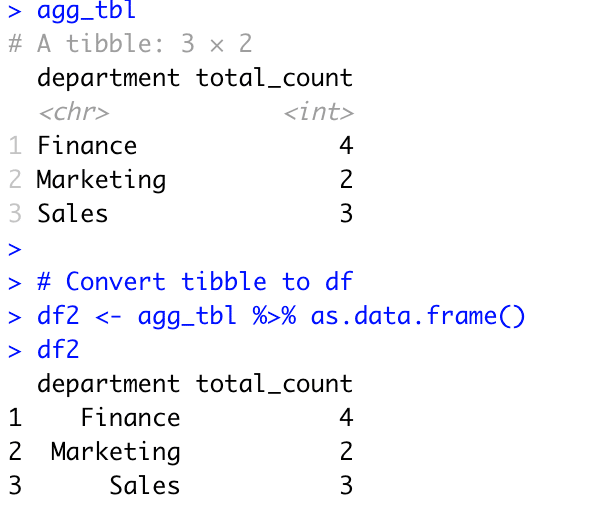
agg_tbl
# Convert tibble to df
df2 <- agg_tbl %>% as.data.frame()
df2
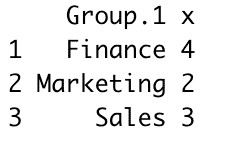
Yields below output. The following example does the group by on department column and get the count for each department.
Note that group_by() and summarise() function returns tibble, if you want DataFrame you should convert tibble to dataframe by using as.data.frame().
3. Group By Count of Multiple Columns in R
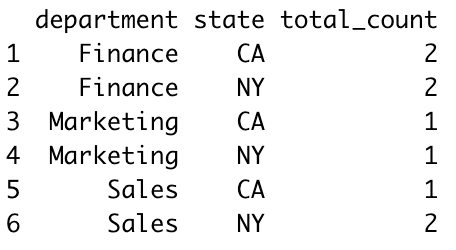
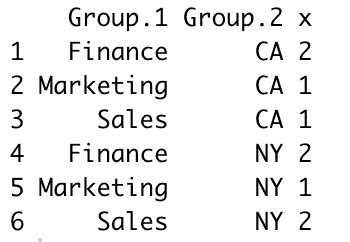
The following example does the group by of department and state columns and get the count for each department & state combination.
# Group by count of multiple columns
df2 <- df %>% group_by(department,state) %>%
  summarise(total_count=n(),.groups = 'drop') %>%
  as.data.frame()
df2
Yields below output.
4. Group By Count using R base aggregate()
R base provides an aggregate() function to perform the grouping on the dataframe, let’s use this to perform a groupby on the department column and get the count for each department.
# Group by count using R Base aggregate()
agg_df <- aggregate(df$state, by=list(df$department), FUN=length)
agg_df
Yields below output.
5. R Base aggregate() on Multiple Columns
The following example uses the aggregate() function to group rows based on department and state columns and uses the length function to get the count for each department & state combination.
# R Base aggregate() on multiple columns
agg_df <- aggregate(df$state, by=list(df$department,df$state), FUN=length)
agg_df
Yields below output.
Conclusion
In this article, I have explained how to do group by count in R by using group_by() function from the dplyr package and aggregate function from the R base. Between these two, dplyr functions perform efficiently when you are dealing with larger datasets.
Related Articles
- R Group by Sum With Examples
- R Group by Mean With Examples
- R Summarise on Group By in Dplyr
- R lm() Function – Fitting Linear Models
- R Group by Multiple Columns or Variables
- R group_by() Function from Dplyr
- R Group by Multiple Columns or Variables