What is a pivot table and how to create it in Pandas? Pandas pivot_table() function is used to make a spreadsheet-style pivot table from a given DataFrame. Using a pivot table we can analyze the data very quickly and it can give more flexibility to make an excel sheet form of a given DataFrame. It can be aggregated in a numeric column as a cross-tabulation against two categorical columns.
In this article, I will explain how to create pivot tables in pandas and understand their syntax and parameters with examples. Creating a pivot table is a process of grouping, summarising, aggregating, and calculating statistics about the specified data in a DataFrame.
1. Quick Examples of Pandas Pivot Table
If you are in a hurry, below are some quick examples of Pandas pivot table.
# Quick examples of pandas pivot table

# Example 1 : Create a pivot table using index
p_table = pd.pivot_table(df, index=['Gender'])

# Example 2 : Create a pivot table using multiple index
p_table = pd.pivot_table(df, index=['Gender', 'Category'])

# Example 3 : Create pivot table using multiple aggfunc
p_table = pd.pivot_table(df, index=['Gender'], aggfunc= {'Fee': 'mean', 'Discount': 'sum'})

# Example 4 : Create table using value parameter
p_table = pd.pivot_table(df, index = ['Gender'], values = ['Discount'], aggfunc = 'mean' )

# Example 5 : Create table using column parameter
p_table = pd.pivot_table(df, index= ['Gender'], columns = ['Fee'], values=['Discount'], aggfunc = 'mean' )

# Example 6 : Fill the NaN value using fill_value
p_table = pd.pivot_table(df, index= ['Gender'], columns = ['Fee'], values=['Discount'], aggfunc = 'mean', fill_value = 0 )
2. Syntax of Pandas Pivot Table
Following is the syntax of the Pandas.pivot_table().
# Syntax of Pandas pivot table.
pandas.pivot_table(data, values=None, index=None, columns=None, aggfunc=’mean’, fill_value=None, margins=False, dropna=True, margins_name=’All’, observed=False)

# Another Syntax
DataFrame.pivot(index=None, columns=None, values=None)
2.1 Parameters of the Pivot Table
Data: DataFrame, whose dataset is turned into pivot table.values: This is an optional parm. Column to aggregate.index :column, Grouper, array, or list of the previous. Index is the feature that provides you to group the data. The index feature appears as an index in the resultant table.columns :column, Grouper, array, or list of the previous. Column, it is used for aggregating the values according to specific features.observed bool, (default False) :This parameter is only applicable for categorical features. If it is set to ‘True’ then the table will show values only for categorical groups.aggfunc: It is an aggregation function and we can set this param with a list of functions, dict, default is numpy.mean. If it is set to a list of functions, the resulting pivot table forms a hierarchical column and this list of functions will be a top-level column. If it is set to dictionary the key is a column to aggregate and the value is a function or list of functions.fill_value: It is scalar or None. Value to replace missing values with (in the resulting pivot table, after aggregation).dropna :Do not include columns whose entries are all NaN.
2.2 Return Value
It returns a DataFrame as an Excel-style pivot table.
3. Create Pandas DataFrame
Python pandas is widely used for data science/data analysis and machine learning applications. It is built on top of another popular package named Numpy, which provides scientific computing in Python. pandas DataFrame is a 2-dimensional labeled data structure with rows and columns (columns of potentially different types like integers, strings, float, None, Python objects, etc.). You can think of it as an excel spreadsheet or SQL table.
Pandas create DataFrame from Python dictionary in which keys are 'Courses', 'Fee', and 'Discount', and values are taken as a list of corresponding key values. Let’s create,
import pandas as pd
# Create a DataFrame
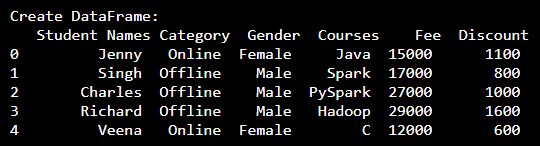
df = pd.DataFrame({'Student Names' : ['Jenny', 'Singh', 'Charles', 'Richard', 'Veena'],
'Category' : ['Online', 'Offline', 'Offline', 'Offline', 'Online'],
'Gender' : ['Female', 'Male', 'Male', 'Male', 'Female'],
'Courses': ['Java', 'Spark', 'PySpark','Hadoop','C'],
'Fee': [15000, 17000, 27000, 29000, 12000],
'Discount': [1100, 800, 1000, 1600, 600]})
print("Create DataFrame:\n",df)
Yields below output.
4. Create Pandas Pivot Table
4.1 Group the Data into Pivot Table using Index Param
Using the Pandas pivot_table() function we can reshape the DataFrame in the form of an Excel pivot table in the simplest way. To group the data in a pivot table we will need to pass a DataFrame into this function and the column you wanted to group as an index. In the below example, I am using 'Gender' column as an index.
# Create a pivot table using index
p_table = pd.pivot_table(df, index=['Gender'])
print(p_table)
Yields below output. Note that by default pivot_table() groups on specified columns and performs the aggregation on all numeric columns. In our example DataFrame, we have Discount and Fee are numeric columns.
# Output:
          Discount           Fee
Gender
Female   850.000000  13500.000000
Male    1133.333333  24333.333333
Here, we have made a basic pivot table in pandas.
5. Create Pivot Table Using Multiple Index
Using the list of features as an index to group the data. This will give more comfort to finding data in the resultant table.
# Create a pivot table using multiple index
p_table = pd.pivot_table(df, index=['Gender', 'Category'])
print(p_table)
Yields below output
# Output:
                   Discount           Fee
Gender Category
Female Online     850.000000  13500.000000
Male   Offline   1133.333333  24333.333333
6. Use Multiple Aggregation Functions
Aggregate function aggfunc param takes np.mean() function as a default function for grouping the data. The values in the pivot table are the result of the summarization that aggfunc applies to the feature data.
We can use different aggregate functions, as I mentioned above if it is set to the dictionary, where the keys are aggregated to columns and values are functions or lists of functions. For example,
Here, I have taken np.mean() and np.sum() as a aggfunc functions.
# Create pivot table using multiple aggfunc
p_table = pd.pivot_table(df, index=['Gender'], aggfunc= {'Fee': 'mean', 'Discount': 'sum'})
print(p_table)
Yields below output.
# Output:
         Discount           Fee
Gender
Female      1700  13500.000000
Male        3400  24333.333333
7. Create Pandas Pivot Table with Values Parameter
The value parameter is used to specify an aggregated column. When not specify this parameter, the function will aggregate all the numerical columns of the dataset (as shown above). The below example selects the columns you wanted on the result.
# Create table using value parameter
p_table = pd.pivot_table(df, index = ['Gender'], values = ['Discount'], aggfunc = 'mean' )
print(p_table)
Yields below output.
# Output:
            Discount
Gender
Female   850.000000
Male    1133.333333
8. Create Pandas Pivot Table Using Column Param
As we can see from the above we have used multiple features as indexes, but using features as the column is given a better understanding of the resultant table than using features as an index.
# Create table using column parameter
p_table = pd.pivot_table(df, index= ['Gender'], columns = ['Fee'], values=['Discount'], aggfunc = 'mean' )
print(p_table)
Yields below output.
# Output:
          Discount
Fee       12000   15000  17000   27000   29000
Gender
Female    600.0  1100.0    NaN     NaN     NaN
Male        NaN     NaN  800.0  1000.0  1600.0
9. Fill the Missing Data in Pandas Pivot Table
Using the fill_value parameter we can fill the Nan values with the specific value provided by the user in a pivot table. It defines scalar or None.
# Fill the NaN value using fill_value
p_table = pd.pivot_table(df, index= ['Gender'], columns = ['Fee'], values=['Discount'], aggfunc = 'mean', fill_value = 0 )
print(p_table)
Yields below output.
# Output:
       Discount
Fee       12000 15000 17000 27000 29000
Gender
Female      600  1100     0     0     0
Male          0     0   800  1000  1600
Frequently Asked Questions on Pandas Pivot Table
A Pivot Table in Pandas is a powerful data manipulation tool that allows you to reorganize and summarize tabular data. It allows you to reshape and aggregate data based on one or more key columns.
You can apply multiple aggregation functions to the same column in a Pivot Table using the aggfunc parameter. The aggfunc parameter accepts either a single aggregation function or a list of aggregation functions.
Handling missing values in a Pivot Table can be achieved using the fill_value parameter in the pivot_table function. The fill_value parameter allows you to replace missing (NaN) values with a specified value.
To create a Pivot Table with subtotals and grand totals, you can use the margins parameter in the pivot_table function. Setting margins to True will add row and column subtotals as well as grand totals.
You can apply custom aggregation functions in a Pivot Table by defining your custom function and passing it to the aggfunc parameter in the pivot_table function.
You can filter data before creating a Pivot Table by using boolean indexing to select the relevant rows based on your filtering criteria.
You can customize the names of the subtotal and grand total columns or rows in a Pandas Pivot Table by using the margins_name parameter. The margins_name parameter allows you to specify the name for the subtotal and grand total rows or columns.
Conclusion
In this article, I have explained Pandas pivot_table() function and using this how to create a pivot table in the form of excel sheets with well-explained examples.
Related Articles
- How to Unpivot DataFrame in Pandas?
- Pandas Correlation of Columns
- Pandas Insert List into Cell of DataFrame
- Drop Rows From Pandas DataFrame Examples
- Pandas – Get Column Index For Column Name
- Change the Order of Pandas DataFrame Columns
- Pandas groupby() and sum() With Examples
- Difference Between loc and iloc in Pandas DataFrame
- Pandas – Drop Infinite Values From DataFrame
- How to Create Pandas Pivot Table Count
- How to Create Pandas Pivot Multiple Columns
- Drop Single & Multiple Columns From Pandas DataFrame